
After two years of COVID-19, there is much useful information now unavailable that government authorities and mainstream media have ignored or underreported.
Here are some honest basic data everyone should know about the chances of dying from the virus or the experimental “vaccines” being forced on millions around the world.
As of December 11, 2021, Earth has experienced 269,420,417 reported COVID-19 cases worldwide.

🔹Around the entire globe there have been 5,311,481 deaths reported.
🔹242,271,569 people recovered.
In the United States, 2,449 out of every 1,000,000 people supposedly get it. There are 333,798,787 people in the US. If you do get COVID-19, there is a 1.75% chance you will die if you are over 70. If you are 30, your odds are less than 1% that you will die from COVID-19.
There is only a 0.24489999999999998 percent chance you will even get COVID-19.
When Drs. David John Sorenson and Vladimir Zelenko released “The Vaccine Death Report” recently, they didn’t play politics and based it strictly on solid facts. There are no unfounded claims and the data presented is clear and verifiable. All associated references have been included for proper peer review.

At the very least, there are five times more deaths from the experimental vaccine shots than are being reported. In all likelihood, the actual figure is much higher.
The Vaccine Adverse Event Reporting System (VAERS) currently logs more than 600,000 cases of severe side effects from the shots, including stroke, heart failure, blood clots, brain disorders, convulsions, seizures, inflammation of the brain and spinal cord, life-threatening allergic reactions, autoimmune disease, arthritis, miscarriage, infertility, rapid-onset muscle weakness, deafness, blindness, narcolepsy and cataplexy.
Even a health care fraud detection expert from the U.S. Centers for Disease Control and Prevention (CDC) came forward with a sworn testimony about how the VAERS database, “while extremely useful, is under-reported by a conservative factor of at least 5.” (See more information regarding this data at the end of this article).
How does COVID-19 and the “vaccinations” compare with the odds of you dying from other causes?
What are your odds of dying from a specific cause?
Knowing the odds is the first step in beating them. However, not all risks faced in life can be accurately estimated. Here’s those odds according to the National Safety Council and Centers for Disease Control:
Heart disease: 1 in 6
Cancer: 1 in 7
Smoking-related: 1 in 9
Chronic respiratory disease: 1 in 26
Stroke: 1 in 28
Obesity-related: 1 in 35
Heavy drinking: 1 in 49
Suicide: 1 in 86
Breast cancer: 1 in 95
Opioid Overdose: 1 in 98
Prostate cancer: 1 in 133
Fall: 1 in 117
Assault: 1 in 211
Brain tumor: 1 in 298
Car accident: 1 in 106
Skin cancer: 1 in 457
Pedestrian accident: 1 in 541
Motorcycle accident: 1 in 890
Drowning: 1 in 1,121
Choking on food: 1 in 2,618

Bicycle accident: 1 in 4,060
Airplane accident: 1 in 7,032
Sunstroke: 1 in 7,770
Flu: 1 in 9,410
Hornet, wasp, bee stings: 1 in 53,989
Lightning: 1 in 188,746
Legal execution: 1 in 96,691
Dog Attack: 118,776
Earthquake: 1 in 148,756
Fireworks discharge: 1 in 386,766
COVID-19: 1 in 2,842,928
The rates are calculated using the cause of death listed on U.S. death certificates.
Lifetime odds are calculated by dividing the population by the number of deaths (creating one-year odds of death), and then, dividing that figure by the life expectancy of a person born today (77.9 years).
🔹It’s notable that between 1903 and 1932, deaths were most prevalent among adults ages 25-44.


🔹Beginning in the 1930s through the mid-1960s, deaths among older adults were dominant.
🔹By the late 1960s through the 1970s, there was a significant increase in deaths among adolescents and young adults 15-24 years of age due to a rise in motor-vehicle crashes among young drivers.

🔹Poisoning deaths began to significantly contribute to the increase in fatalities among 25- to 44-year-olds in the 1980s and among 45- to 64-year-olds starting in the 1990s. This increase was largely driven by opioid drugs.
🔹The 1990s also saw an increase in deaths of adults 75 and older, reflecting an increase in fall-related deaths.

Among adults 75 and older, deaths are driven by falls.
These trends continue to the present day and are the real problems we should be addressing, but politics and greed are in the way. The current age distribution of deaths is dominated by the middle-age population, ages 25-64, driven by the opioid epidemic.
According to the American Academy of Pediatrics (AAP), one child dies every five days from choking on food, making it the leading cause of death in children ages 14 and under.
The most common foods for choking are hot dogs, carrots, apples, grapes, nuts, peanut butter, marshmallows, gum, hard candy and popcorn.


VAERS is under reporting
Part of the problem with VAERS is that deaths are only attributed to the vaccines if they occur outside of a two-week window. Those that occur within that window are not logged because the CDC decided not to consider a person “vaccinated” until 14 days have passed post-injection.
CDC knows the common knowledge that less than 0.3% of all adverse drug events and 1-13% of serious events are reported to the Food and Drug Administration (FDA). Likewise, fewer than 1% of vaccine adverse events are even reported.
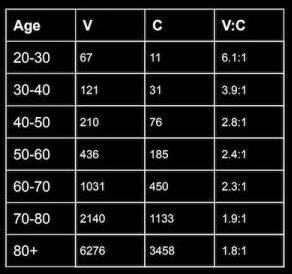
In vaccine nomenclature, “V:C” is the ratio of the the number of vaccine-caused deaths (V) relative to the projected number of COVID deaths (C) that could be saved by the vaccine over a 6 month period. A number like 2:1 means we kill 2 people for every COVID death we save. That’s not even close to being anywhere near acceptable.
V:C in the US is not favorable for any age. This table shows the V:C numbers by age.
Why are people putting themselves at greater risk taking these experimental shots?
Please Support These American Owned Businesses
___________________________
Get Your Natural Vitamins A & D from the Sea!


___________________________


I was going to write a pithy commentary about whatever the chances, it’s still not worth the ridiculous Clown World they’re building around the hype.
LikeLiked by 3 people
[…] What Are The Real Odds You Will Die From COVID-19? — Clever Journeys […]
LikeLike
When I was a child a piece of ice got stuck in my throat. I went running to my dad “I’ve got a piece of ice stuck in my throat” I croaked…he rubbed my back and told me it would melt. I know now he was also chuckling under his breath…before I knew it, it had melted and I was back running around. Same thing with a peppermint candy, he gave me some warm water, and on down it went!
Just thought I’d share…I laugh now, but I was probably only 4 or 5 at the time. I’d rather take my chances with a piece of ice, lightning, or riding my back than with the so called vaccine.
LikeLiked by 2 people
Wow! Same thing happened with me with ice. To this day I’m careful with ice & prefer crushed ice. LOL.
LikeLiked by 2 people